Centers around Central Square and Ruskin Place
Table Service
Bud and Alley's Waterfront Restaurant and Bar
The Daytrader Tiki Bar and Restaurant
Quick service or bar seating
Airstream Row (Quick bites along 30A in the heart of Seaside)
Other things to do
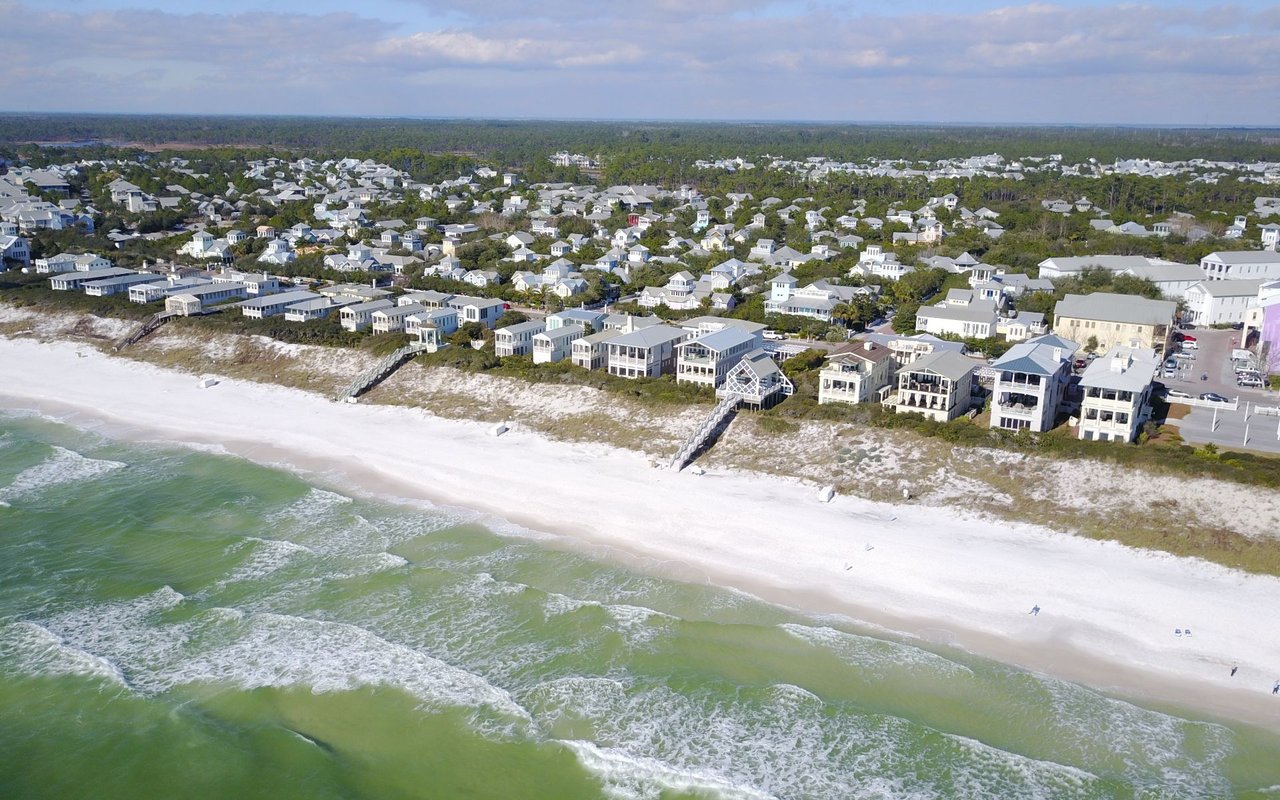
180 people live in Seaside, where the median age is 53 and the average individual income is $108,922. Data provided by the U.S. Census Bureau.
Total Population
Median Age
Population Density Population Density This is the number of people per square mile in a neighborhood.
Average individual Income
There's plenty to do around Seaside, including shopping, dining, nightlife, parks, and more. Data provided by Walk Score and Yelp.
Explore popular things to do in the area, including M&P, Distillery 98, and Captain Phil's Charters.
| Name | Category | Distance | Reviews |
Ratings by
Yelp
|
|---|---|---|---|---|
| Dining | 4.94 miles | 7 reviews | 5/5 stars | |
| Dining | 4.74 miles | 28 reviews | 4.9/5 stars | |
| Active | 3.96 miles | 9 reviews | 5/5 stars | |
| Active | 3.97 miles | 5 reviews | 5/5 stars | |
| Active | 4.02 miles | 5 reviews | 5/5 stars | |
| Active | 0.15 miles | 6 reviews | 5/5 stars | |
| Active | 3.14 miles | 9 reviews | 5/5 stars | |
| Active | 4.09 miles | 5 reviews | 5/5 stars | |
| Active | 2.96 miles | 46 reviews | 5/5 stars | |
|
|
||||
|
|
||||
|
|
||||
|
|
||||
|
|
||||
|
|
Seaside has 109 households, with an average household size of 2. Data provided by the U.S. Census Bureau. Here’s what the people living in Seaside do for work — and how long it takes them to get there. Data provided by the U.S. Census Bureau. 180 people call Seaside home. The population density is 1,604 and the largest age group is Data provided by the U.S. Census Bureau.
Total Population
Population Density Population Density This is the number of people per square mile in a neighborhood.
Median Age
Men vs Women
Population by Age Group
0-9 Years
10-17 Years
18-24 Years
25-64 Years
65-74 Years
75+ Years
Education Level
Total Households
Average Household Size
Average individual Income
Households with Children
With Children:
Without Children:
Marital Status
Blue vs White Collar Workers
Blue Collar:
White Collar: